This was a HS in Illinois until renaming in 1981.
.
This one comes to us via Tankathon, work done by a Haaavad crew
They show their methodology for valuing a draft pick. The old Jimmy Johnson chart over-values the top picks and undervalues the mid round picks in their view. Lots of different trade charts these days, I'm guessing you could find 4-5 different methods and results. This one leans on " Approximate Value" - the metric developed by Pro Football Reference
https://harvardsportsanalysis....lue-nfl-draft-picks/
Taking data from www.pro-football-reference.com, I have created a much better system that more accurately values each pick in the NFL draft, similar to the work done by Chase Stuart. Pro-Football-Reference uses a metric called Career Approximate Value (CAV) that allows one to compare players across seasons and positions. It is not meant as the ultimate NFL statistic. It is useful for comparing large groups of players across time and positions, which is exactly the objective here.
@Satori posted:.
This one comes to us via Tankathon, work done by a Haaavad crew
They show their methodology for valuing a draft pick. The old Jimmy Johnson chart over-values the top picks and undervalues the mid round picks in their view. Lots of different trade charts these days, I'm guessing you could find 4-5 different methods and results. This one leans on " Approximate Value" - the metric developed by Pro Football Reference
https://harvardsportsanalysis....lue-nfl-draft-picks/
Taking data from www.pro-football-reference.com, I have created a much better system that more accurately values each pick in the NFL draft, similar to the work done by Chase Stuart. Pro-Football-Reference uses a metric called Career Approximate Value (CAV) that allows one to compare players across seasons and positions. It is not meant as the ultimate NFL statistic. It is useful for comparing large groups of players across time and positions, which is exactly the objective here.
One thing that the charts may not take into account enough is how much more value a pick at the end of round 1 is relative to a pick at the top of the 2nd round. If you hit on a first-round pick, you get to control them for an additional year by extending that 5th-year option.
The difference in value between the 32nd pick and the 33rd pick is probably the largest in the draft outside of maybe 1st vs. 2nd overall.
That option allows the Packers to extend Jordan Love at about 20 million for year 5 this off-season. If he would have been the top pick in the second round, they'd be forced to make a decision on whether to franchise tag him or sign a big extension after this off-season.
Of course, Gutey made a poor decision on Savage, but it did help with Jaire Alexander and gave them more leverage to negotiate the extension.
@MichiganPacker posted:One thing that the charts may not take into account enough is how much more value a pick at the end of round 1 is relative to a pick at the top of the 2nd round. If you hit on a first-round pick, you get to control them for an additional year by extending that 5th-year option.
Its a very important consideration for sure, but the rate of 5th year options isn't 100%. The Packers and Ravens ( both good-drafting teams) are tied with 61 % of their options exercised and they are exactly in the middle of all 32 teams in term of rate.
Houston is tops at 100 % and the Browns, Raiders and Jags bring up the rear with 32 % of their 5th year options exercised.
Sometimes teams don't exercise and instead sign a new extension so while that option certainly has a value, its tough to nail down given the variety of outcomes.
I would also push back on the Savage 5th year extension being a poor decision- that story isn't fully written yet. It may be, it may not.
For some its a forgone conclusion, but that's premature in my view.
2023 should bring us some answers
@Satori posted:
Beware of people who open with statements like this…
Lots of insightful things
Quick note of thanks for your work around here, genuinely appreciate what you add to X4
.
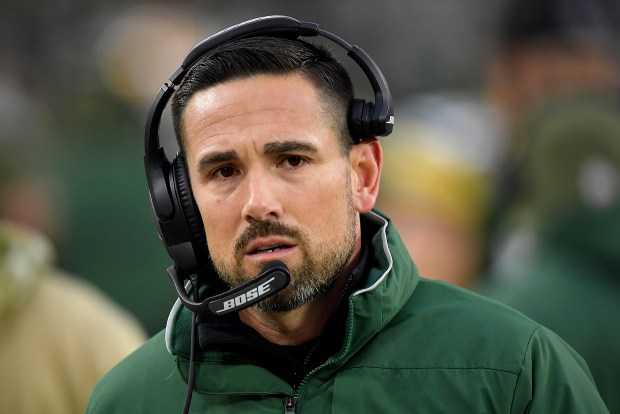
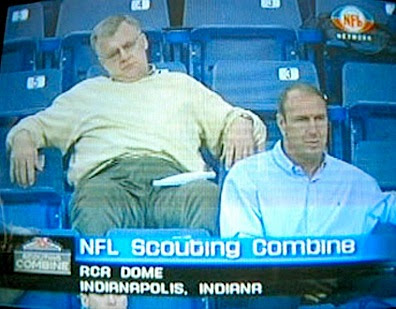
Matt La Fleur will NOT see you at the Scouting Combine - GB coaches taking a pass on this year's festivities.

@Satori posted:Quick note of thanks for your work around here, genuinely appreciate what you add to X4
I enjoy your contributions as well.
I get that it's mostly the personnel department's area and the interview slots are short, but "staying home to work on scheme" with Joe Barry seems even more pointless. ![]()
Tank Bigbsgy reminds me of the Wilson/Mitchell type RBs that San Fran goes through like a drug dealer and burner phones. One cut and go, not really dynamic but a guy who gets chunk yards behind a good line.
@mrtundra posted:My latest PFF mock. No trades.
Pretty good draft, but isn't Herbig a bit small to be an NFL edge rusher? I could also see a receiver in the fourth, but not a running back.
Dalton Kincaid over the past two seasons:
🔥 138 Targets
🔥 2 Drops
Kincaid is Daniel Jeremiah's #1 TE.
Anton Harrison is on the rise.
@Packmeister posted:Pretty good draft, but isn't Herbig a bit small to be an NFL edge rusher? I could also see a receiver in the fourth, but not a running back.
Herbig's size will cost him quite a bit if a team sees him as an Edge. He's not the same player Chenal or Baun were before him, either, let alone as dynamic as Nolan Smith or Nick Bonitto last year,
@D J posted:Dalton Kincaid over the past two seasons:
🔥 138 Targets
🔥 2 Drops
He will be gone before the Packers decide to spend a pick on him.
As I said before in a previous post about Tank, everyone should have a tank.
And if not for the name, then for the hair, enough to make Kiel jealous.
I think Tank would be a great addition - get him the ball with some space, and he's gone.
@D J posted:Anton Harrison is on the rise.
Word on Harrison is he's not strong enough, yet. But, he does have prototype-size for the tackle position. We'd be betting on a high ceiling, rather than a high floor.
@Chongo posted:
Still in use today...
As is the Maniacs from Orofino, Idaho.
if they pick Branch, hopefully he is better than the other Alabama safety they took in the 1st round. HaHa should have been LOL.
Zay Flowers.
What about Zay Flowers? You like him, or don't like him, or don't really care one way or the other? lol
@Floridarob posted:if they pick Branch, hopefully he is better than the other Alabama safety they took in the 1st round. HaHa should have been LOL.
One thing Branch can do that HaHa couldn't is tackle.
Throughout his entire career at Maryland, Deonte Banks only allowed 50+ yards in a game ONCE.
@Chongo posted:He will be gone before the Packers decide to spend a pick on him.
He's missing doing drills at the combine because of a back issue, meaning the Packers have likely crossed him off their list.
@Packmeister posted:What about Zay Flowers? You like him, or don't like him, or don't really care one way or the other? lol
Like him.
Zay Flowers is sub 6' and sub 195lbs...last time the Packers veered from these measures it was Calamari Rodgers. Don't see them doing that again.
I like Flowers, too, but he's looking like a first-rounder. I think you can find similar players in the 2nd - 4th rounds. He's like a luxury the Packers probably can't or won't afford, but there are alternatives on day 2 if they want to add a dynamic receiver like that.
@Chongo posted:Zay Flowers is sub 6' and sub 195lbs...last time the Packers veered from these measures it was Calamari Rodgers. Don't see them doing that again.
I agree, but you could make the argument that the big difference between the two guys is speed and elusiveness, which Flowers has in spades.
@Packmeister posted:I agree, but you could make the argument that the big difference between the two guys is speed and elusiveness, which Flowers has in spades.
Yeah, because one guy failed shouldn't mean they won't try another guy who is a better prospect. But we do what we do, to our detriment.
Players we like seldom are the same as the ones Gutey likes in my experience.
Sure seems that way...I think he likes to defy convention, and can't stand the "draftniks" on TV & radio. Whether that's good or bad is up for debate, but the proof is in his draft record.
Amari was also more of a fire hydrant than sleek. Jalin Hyatt would be the guy I'd love to see them swing at, but I don't see them bending on "blocking ability".
If the pack truly want to set up Love to succeed, they will draft a tackle, not a wr in the first round


